According to data from the Race Disparity Audit published in 2018, just 5% of the UK’s small businesses are majority-led by someone from an ethnic minority group, despite 13% of the UK population belonging to a black, Asian, mixed or other ethnic group. This is a significant disparity. In accordance with the PM’s 2016 pledge that if an ethnic disparity cannot be explained then action must be taken to tackle the injustice, the Government are financially supporting ethnic minority entrepreneurs to address the inequality.
At TechRound, we will soon be releasing our list of the top 50 BAME entrepreneurs and startups in the UK. Watch this space!
The Race Disparity Audit
The Race Disparity Audit is a report which presents data that paints a ‘picture of life’ for people in different ethnic groups in the UK. Different aspects of people’s lives, experiences and future prospects vary significantly depending on the ethnic group they belong to.
The report found that, “There are disparities between ethnic groups in all areas of life affected by public organisations. Some are more pronounced than others or have a greater impact on people’s life chances and quality of life. In some areas, disparities are reducing, while in others, they are static or increasing.”
What Proportion of Entrepreneurs Are BAME?
In 2017, nearly 8% of the ethnic minority population were involved in starting or running a new business – compared to 14.5% of the white population. According to data published in 2018, 15% of workers in the UK are self-employed. While Pakistani and Bangladeshi workers are most likely to be self-employed (1 in 5) black workers are least likely to be. Being self-employed isn’t necessarily the same as being an entrepreneur, but this data is certainly indicative.
How do Employments Rates Vary Among Different Ethnic Groups?
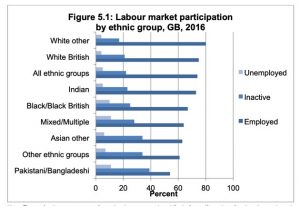
For all ethnic groups, the majority of adults of working age (16 to 64) were employed, either as an employee or self-employed. Pakistani and Bangladeshi are the least likely to be in work, while employment is highest among white people.
Employment rates by ethnic group (as of 2016)
- White Other – 80%
- White British – 75%
- Indian – 73%
- Black/Black British – 67%
- Pakistani/Bangladeshi – 53%
Which Ethnic Groups Are Most Likely to Live in Poverty?
The report found that relative to the UK population overall, people living in households headed by someone in the Asian, Black or Other ethnic groups were disproportionately likely to be on a low income. Almost half of households in these ethnic groups had incomes in the bottom 40% nationally before housing costs were taken into account
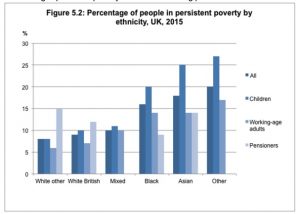
These groups were also the most likely to be in persistent poverty, defined by having less than 60% of median income in 3 of the last 4 years after taking the size and composition of households into account:
- 18% of 28 Asian households
- 16% of Black households
- 20% of Other ethnic group households
- 9% of White British households
In terms of actual amounts of income, Black households and those from Other ethnic groups were most likely to have gross weekly income from all sources of less than £400 with over 1 in 3 households in this income bracket. Overall, according to data from the Bank of England, ethnic minorities in the UK earn around 10 per cent less than white workers, even once individual and job characteristics are taken into account.
What is the Government Doing to Tackle the Disparities?
The Race Disparity Audit itself was an important step in addressing the pervasive inequality in our society – acknowledgement of the facts. The disparities are clearly wide-ranging, so taking it one step at a time, as the Government is doing, seems to be the best approach. Through the Start Up Loans scheme, they are offering extra support to ethnic minority-led startups, to increase the number of small businesses led by BAME entrepreneurs.
- More than 11,000 black, Asian and ethnic minority (BAME) entrepreneurs have received government-backed startup loans since 2012 – that’s over 1 in 5 of all the loans given out
- Ethnic minority entrepreneurs are receiving start-up loans at a higher rate. In 2017, 5.7 black entrepreneurs per 10,000 people received a start-up loan, compared with 2.4 white entrepreneurs per 10,000 people
To take a look at all the data, click here to view a PDF of the Race Disparity Audit.
Sources
- The Race Disparity Audit
- Annual Population Survey, Department for Work and Pensions
- Understanding Society Survey, Department for Work and Pension
- Ethnicity Facts & Figures: www.ethnicity-factsfigures.service.gov.uk